In the fast-paced world of digital marketing, reporting and dashboard tools are crucial for efficient data analysis and decision-making. These tools help businesses visualize their data, track performance, and gain actionable insights. In this article, we’ll discuss the benefits of reporting and dashboard tools and how Metric Mavens can assist you in leveraging these tools effectively.
What Are Reporting and Dashboard Tools?
Reporting and dashboard tools are software solutions designed to collect, analyze, and present data in a visually intuitive format. They enable users to create reports and dashboards that display key metrics, trends, and performance indicators. Consequently, businesses can make informed decisions based on real-time data.
Benefits of Using Reporting and Dashboard Tools
Utilizing reporting and dashboard tools offers several advantages:
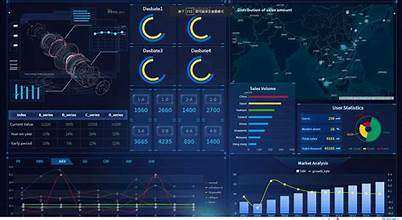
- Enhanced Data Visualization: Reporting and dashboard tools provide visual representations of data, such as charts and graphs. As a result, this makes complex data easier to understand and interpret.
- Real-Time Insights: These tools offer real-time data updates, allowing businesses to monitor performance and track metrics continuously. Consequently, this helps in making timely adjustments to strategies.
- Customizable Reports: Users can create customized reports that focus on specific metrics and KPIs relevant to their business goals. This customization ensures that the reports meet the unique needs of each organization.
- Improved Decision-Making: By presenting data in a clear and organized manner, reporting and dashboard tools facilitate better decision-making. Marketers can quickly identify trends, track performance, and make data-driven decisions.
- Increased Efficiency: Automating the reporting process saves time and reduces manual errors. Therefore, businesses can focus on analyzing data and developing strategies rather than spending time on data collection.
Popular Reporting and Dashboard Tools
Several reporting and dashboard tools are available, each offering unique features. Here are a few popular options:
- Google Data Studio: A free tool that allows users to create customizable reports and dashboards using data from various sources, including Google Analytics and Google Ads.
- Tableau: A powerful data visualization tool that helps users create interactive dashboards and reports. It integrates with multiple data sources for comprehensive analysis.
- Microsoft Power BI: A business analytics tool that provides interactive visualizations and business intelligence capabilities. It allows users to create detailed reports and dashboards.
- Looker: A data platform that offers advanced analytics and reporting features. It enables users to explore and analyze data to gain valuable insights.
How to Choose the Right Tool
When selecting a reporting and dashboard tool, consider the following factors:
- Ease of Use: Choose a tool that is user-friendly and requires minimal training for your team. A tool with an intuitive interface will enhance productivity.
- Integration Capabilities: Ensure the tool integrates with your existing data sources and platforms. Seamless integration allows for efficient data import and analysis.
- Customization Options: Look for tools that offer customization features to tailor reports and dashboards to your specific needs.
- Cost: Evaluate the cost of the tool and its features. Some tools offer free versions with limited capabilities, while others require a subscription or license.
Metric Mavens: Your Partner in Reporting and Dashboard Tools
At Metric Mavens, we understand the importance of effective reporting and d tools for your business. As the leading marketing agency in Nepal, we offer comprehensive solutions to help you select and utilize the right tools for your needs.
Our Reporting and Dashboard Tools Services
- Tool Selection and Implementation: We assist in selecting and implementing the best and dashboard tools for your business, ensuring they align with your objectives.
- Customization and Integration: Our team customizes reports and dashboards to meet your specific needs and integrates them with your existing data sources.
- Training and Support: We provide training and support to help you and your team effectively use reporting and tools for data analysis and decision-making.
- Ongoing Monitoring and Optimization: We continuously monitor and optimize your reporting and d tools to ensure they deliver accurate and valuable insights.
Conclusion
In conclusion, reporting and d tools are essential for efficient data analysis and decision-making. By leveraging these tools, businesses can visualize data, track performance, and make informed decisions. At Metric Mavens, we are committed to helping you maximize the benefits of reporting and d tools and drive your business forward.
To learn more about how Metric Mavens can help you with reporting and d tools, contact us today.